Guides
Introduction
Hivemind Basic
Hivemind Advanced
Featurehub
Investos
Other
Hivemind: Custom Pipelines
What Are Hivemind Custom Pipelines?
Hivemind custom pipelines expose the full set of tools used internally to construct company exposures.
They allow users to build end-to-end pipelines by combining structured data (from FeatureHub and elsewhere), unstructured data, and GenAI-driven transformations into custom, point-in-time derived signals.
Pipelines are fully configurable, with user-defined inputs, processing nodes / instructions, and outputs.
They can be used to create bespoke exposures, risk / alpha signals, or entirely new analytical artifacts beyond the standard Hivemind objects.
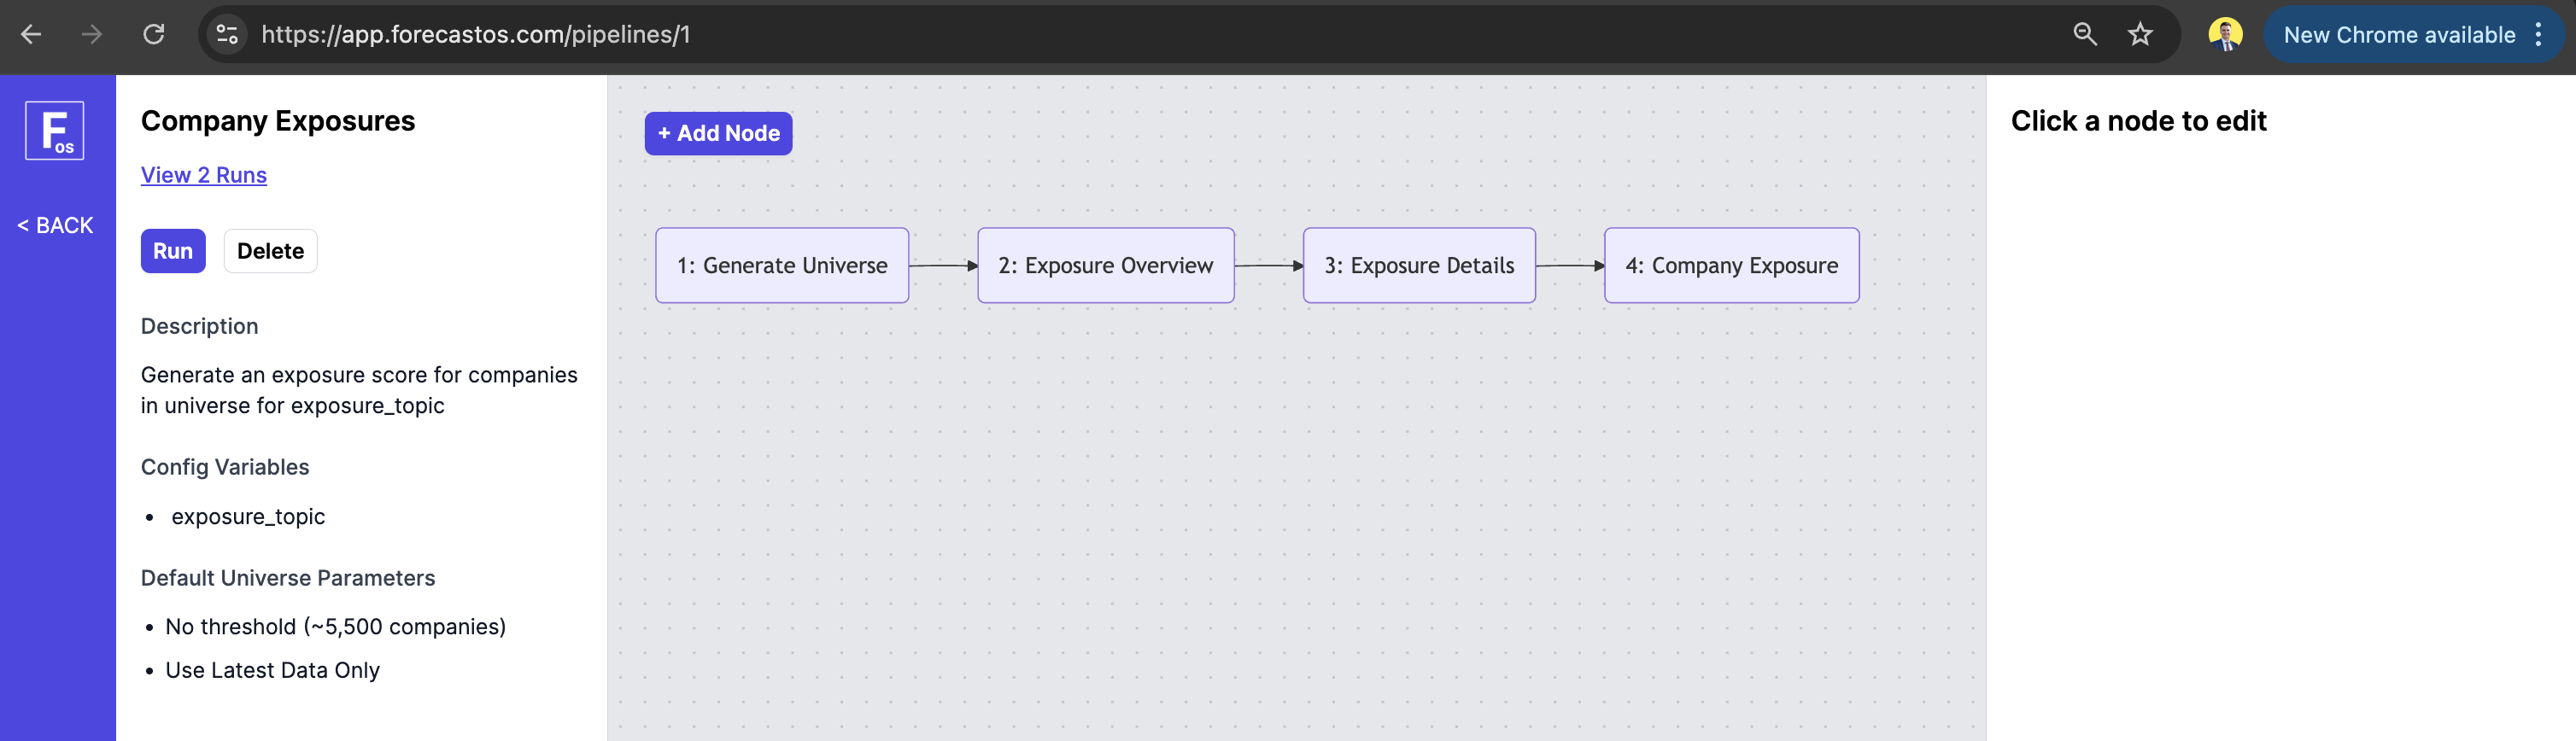
UI Access
Custom pipelines can be built and inspected in the ForecastOS UI, where users visually compose nodes, configure transformations, and access outputs.
API Access
Pipeline run creation and associated outputs are accessible via API.
Example: Running Pipelines via API
curl -X POST "https://app.forecastos.com/api/v1/pipelines/<PIPELINE_ID>/runs" \
-H "Authorization: Bearer YOUR_API_TOKEN" \
-H "Content-Type: application/json" \
-d '{
  "generate_charts": true,
  "use_latest_data_only": false,
  "start_date": "2025-01-01",
  "end_date": "2026-01-01",
  "variables": {
    "var1": "value1",
    "var2": "value2"
  }
}'
Body Parameters
| Parameter | Type | Default | Required | Description |
|---|---|---|---|---|
| generate_charts | boolean | pipeline default | No | If true, charts will be automatically generated once pipeline results are complete. |
| use_latest_data_only | boolean | pipeline default | No | If true, only the latest available data will be used for the pipeline run. Otherwise, a start and end date can be provided to limit the data range. |
| latest_data_as_of_date | string | current date | No | The reference date for the latest data, set this if use_latest_data_only is true. Must be in YYYY-MM-DD format. |
| start_date | string | "2016-01-01" | No | Only include data published from this date. Set this if use_latest_data_only is false. Must be in YYYY-MM-DD format. |
| end_date | string | current date | No | Only include data published up to this date. Set this if use_latest_data_only is false. Must be in YYYY-MM-DD format. |
| variables | object | - | Yes | A dictionary of variables for the pipeline. Must include keys for all expected pipeline variables. |
Response
{
  "id": 101,
  "pipeline_id": 6,
  "status": "running",
  "created_at": "2026-01-12T18:22:14.050Z"
}
Example: Fetching Pipeline Run Results via API
curl -X GET "https://app.forecastos.com/api/v1/pipelines/<PIPELINE_ID>/runs/<PIPELINE_RUN_ID>" \
-H "Authorization: Bearer YOUR_API_TOKEN" \
-H "Content-Type: application/json"
This returns a time-series CSV containing company-level results for your pipeline run.
Open-Source Access
The open-source ForecastOS Python library provides helpers for consuming pipeline outputs and integrating them into downstream research, risk, and portfolio workflows.
Example: Running Pipelines via OS
import forecastos as fos

run_pipeline_response = fos.Pipeline.run_pipeline(
  pipeline_id=6,
  config={
    "generate_charts": True,
    "use_latest_data_only": True,
    "start_date": "2025-01-01",
    "end_date": "2026-01-01",
    "variables": {
      "var1": "value1",
      "var2": "value2"
    }
}
)
Config Parameters
| Parameter | Type | Default | Required | Description |
|---|---|---|---|---|
| generate_charts | boolean | pipeline default | No | If true, charts will be automatically generated once pipeline results are complete. |
| use_latest_data_only | boolean | pipeline default | No | If true, only the latest available data will be used for the pipeline run. Otherwise, a start and end date can be provided to limit the data range. |
| latest_data_as_of_date | string | current date | No | The reference date for the latest data, set this if use_latest_data_only is true. Must be in YYYY-MM-DD format. |
| start_date | string | "2016-01-01" | No | Only include data published from this date. Set this if use_latest_data_only is false. Must be in YYYY-MM-DD format. |
| end_date | string | current date | No | Only include data published up to this date. Set this if use_latest_data_only is false. Must be in YYYY-MM-DD format. |
| variables | object | - | Yes | A dictionary of variables for the pipeline. Must include keys for all expected pipeline variables. |
Example: Fetching Pipeline Run Results via OS
df_pipeline_run_results = fos.Pipeline.get_df(pipeline_id=6, run_id=19)
This returns a time-series DataFrame containing company-level results for your pipeline run.
Next: Hivemind Risk Applications
Let's explore Hivemind Risk Applications next.